Input
31.2304° N
121.4737° E
121.4737° E
One coordinate pair is enough. MoRA inference does not require satellite tiles, POI databases, mobility logs, or census tables at runtime.
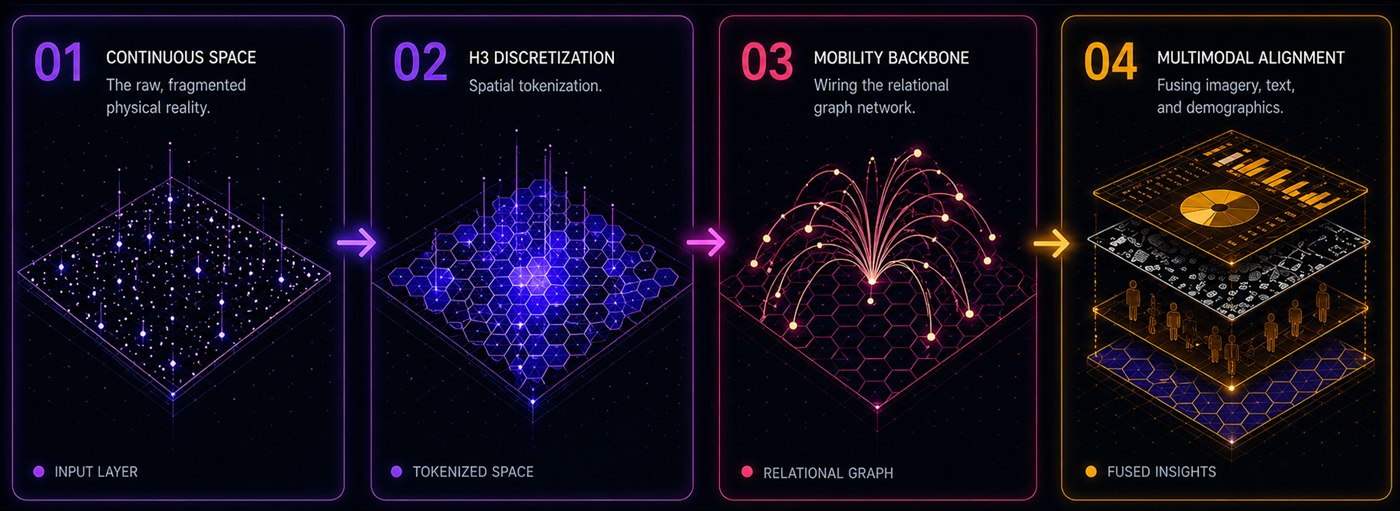
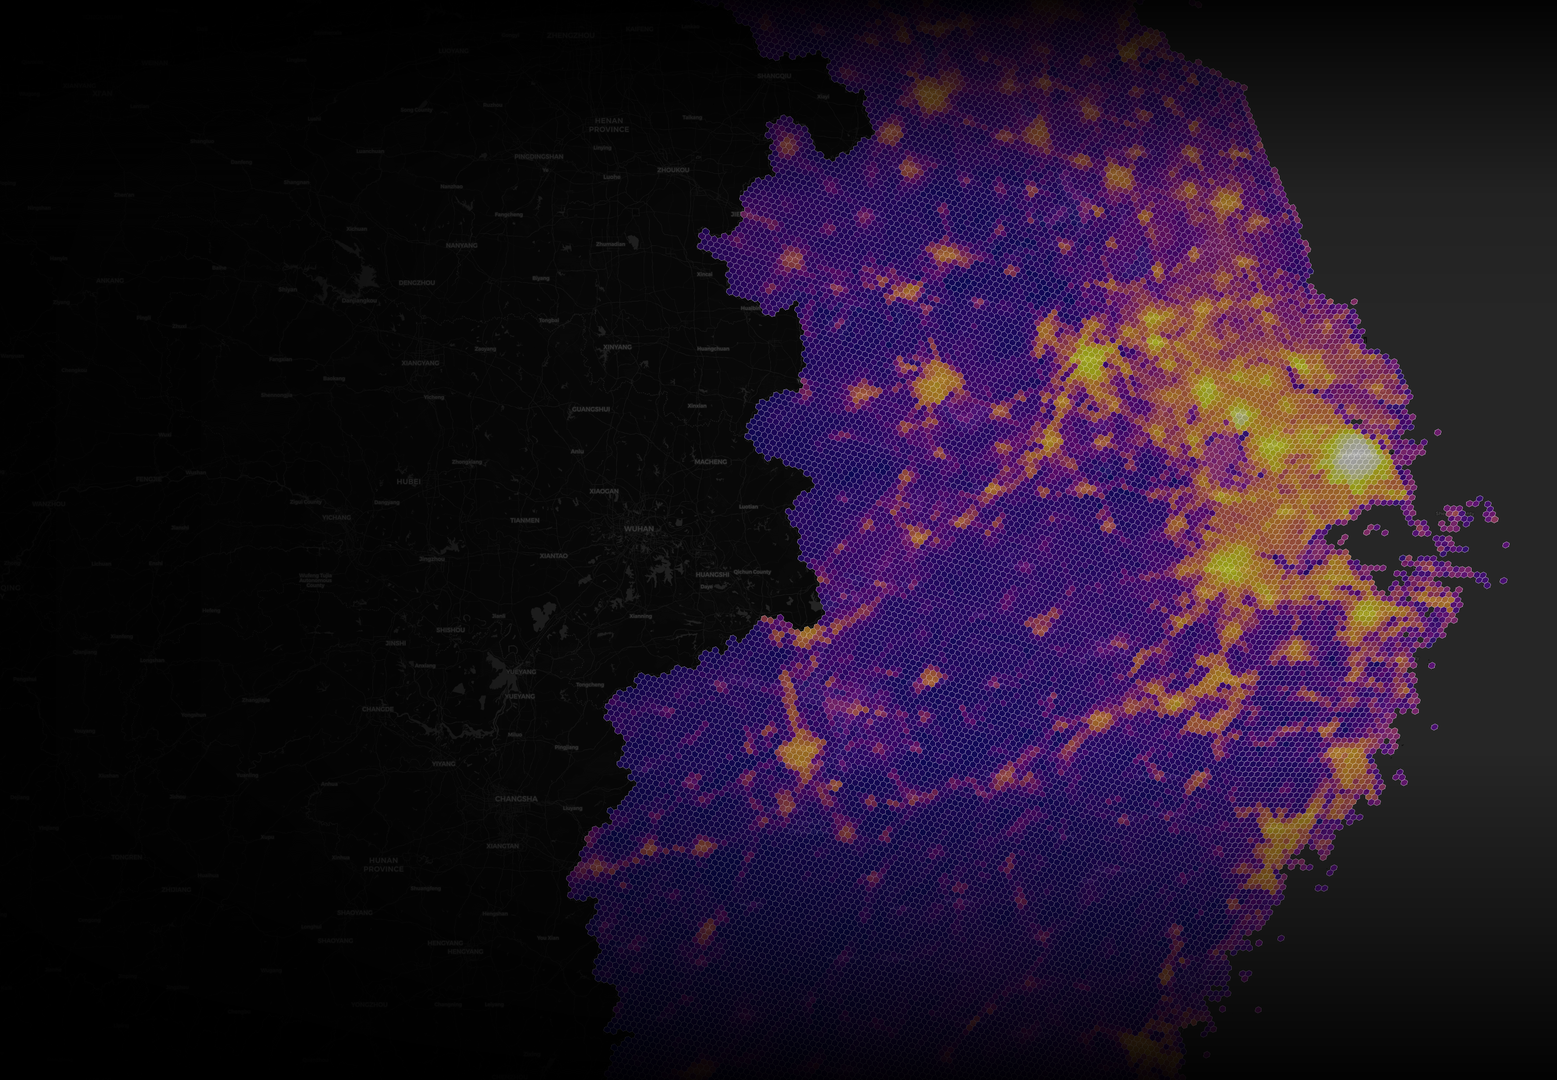
MoRA encodes locations across the entirety of China into compact 128-dimensional representations capturing their socio-economic and functional DNA by anchoring satellite imagery, 100M+ POIs, and demographics to a billion-edge mobility graph.
01 — The question
There have gradually emerged two main paradigms in geospatial representation learning: one grounds locations in their physical attributes, while the other represents them through patterns of human activity that unfold within them.
Earth Observation
Satellites, radar, LiDAR. These build a digital twin of the planet's surface — land cover, terrain, built environment. Powerful for monitoring, capturing the physical state of locations.
Physical stateHuman-Centric
Mobility, demographics, points of interest. A train station and an adjacent park share near-identical pixels, but radically different human dynamics.
Functional meaningMoRA's claim is fundamentally human-centric. MoRA posits that a location's latent meaning lies less in its intrinsic attributes and more in its functional relationships with other places, as revealed by human movement.
02 — MoRA's core insight
MoRA borrows its theoretical logic from LLMs: meaning emerges from how discrete tokens co-occur in context. H3 grid cells become spatial tokens, and human mobility sequences provide the context that reveals each region's latent functional meaning.
03 — Model architecture
By using a human mobility graph as the central backbone for multimodal alignment, MoRA ensures POI text, satellite imagery, and demographic signals are interpreted through the lens of fundamental human dynamics.
04 — Results
We construct a comprehensive benchmark of 9 general-purpose prediction tasks across 4 spatial scales (point, grid, county, city) in social and economic domains, explicitly emphasizing human-centric evaluation.
05 — Try MoRA
The distilled MoRA model compresses an entire national-scale multimodal pipeline into a single function call. No satellite tiles. No POI databases. No mobility logs. Just coordinates (longitude/latitude).
One coordinate pair is enough. MoRA inference does not require satellite tiles, POI databases, mobility logs, or census tables at runtime.
model = load_distilled_mora(model_path)

coord = [121.4737, 31.2304] # lon, lat

emb = model.encode(coord)
A single `encode(coord)` call returns a ready-to-use location fingerprint.
Encodes mobility, POI, imagery, and demographics into one compact vector representation.